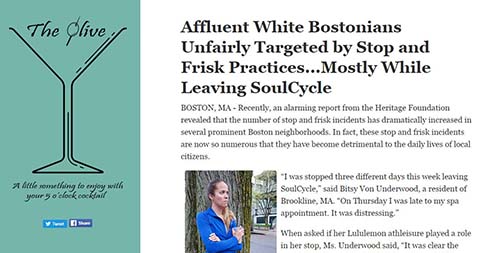
Screenshot of the project webpage.
By Catherine Caruso, Kendra Pierre-Louis, Tiffany Wang
Materials
Webpage article with clickable annotations
Methodology
This project builds on a previous project that combined a satirical Onion-style article with a fake map. Now, our piece appears on our own satirical website, The Olive, a nod to the real satirical website, The Onion. The satirical main text is annotated using Genius with real facts about stop and frisk practices in Boston. It also includes a map that toggles back and forth between the real data and the satirical data. At the bottom of the article we include an explicit call to action, and a number of different options for learning more and getting involved.
We wanted to see if satire could be used to both inform, i.e. like real news, as well as possibly affect behavior.
The main dataset used in this report is used the Stop and Frisk (FIO) dataset that the Boston Police Department released after being sued by the American Civil Liberties Union (ACLU). Catherine D’Ignazio provided us with a geocoded version of the dataset that we used to create maps. The data indicate that the areas with the highest density of stop and frisk incidents are also the areas with more people of color, and most people that are targeted by stop and frisks are black men. We also used US Census data to provide the community descriptors – median incomes, and racial demographics – of the communities mentioned in the article (both the satirical data and the real data), along with Catherine’s extensive knowledge of Gisele Bündchen and Tom Brady.
The website is hosted by GitHub and was created in Jekyll. The annotations were created in Genius, and draw from a combination of the  ACLU report (PDF - 9.3MB), Census data, and the actual stop and frisk dataset. The satirical article includes the same stop and frisk statistics, but flips them so they apply to affluent, white citizens in Brookline and Milton. It also cites general race and income information for those neighborhoods. To avoid copyrighting issues, we included a photo of Gisele that is available for public use and photos of friends who agreed to be photographed for this project.
For the maps, we used cartoDB’s density map function to show the density of stop and frisk incidents happening in the areas around Boston. The density map split the data into seven different bins. In cartoDB, we altered the code to change the color scheme (cartoDB only has one inverted color scheme, which is from white to pink). We also created a manipulated map, where we flipped the color scheme, and used PowerPoint to add stop and frisk incidents to the Brookline and Milton areas. We used JuxtaposeJS to create a map with a slider that moves between the actual and manipulated versions.
To assess the efficacy of the website, we did a series of five informational interviews with people. In all of the interviews we asked a pre-question:
"On a scale of 1-5, with 1 being the least, and 5 being the most, how much do you know about stop and frisk practices in Boston?"
If the respondent said three or higher, we followed up with the question:
"On the same scale of 1-5, how problematic are current stop and frisk practices in Boston?"
Then the interviewee would go through the website. We used a screen recording the website to see how the reader’s engaged with the website. Afterwards we asked them a series of informational questions:
- How did this piece make you feel? (prompting questions if respondent asked for clarification: Did you think it was entertaining? Did you think it was surprising?)
- What was your overall reaction to this piece?
- How did the balance of humor and real facts work for you?
- Did you notice the annotations and click on them while you were reading?
- Could you tell the difference between the joke data and the real data?
- Did you trust the real data?
- Do you feel motivated to do something about this problem?
- Which action at the bottom would you be most likely to take?
- Did this article change your opinion of stop and frisk practices in Boston?
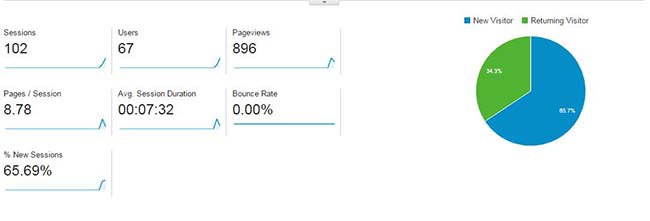
As a final information gathering mechanism, we installed Google Analytics on the site to track visitor behavior.

Google Analytics visitor data for the page.
Once the site was completed, we encouraged people in our network – via email, Facebook, and Twitter – with connections to the Boston area to read the site. Some of the tweets used bit.ly to further allow for additional engagement tracking.
Goals & Audience
According to the ACLU, current stop and frisk practices in Boston are highly problematic-they disproportionately target people of color in low income neighborhoods. In fact, many people in these neighborhoods are subjected to so many stop and frisks that their daily lives are disrupted. Rather, than replicate them here below, you can find the complete statistics about stop and frisk practices in Boston in the annotation layer of our article.
Unfortunately, the individuals that are subjected to unfair stop and frisk practices often struggle to have their opinions heard by those in positions of political power who can actually change these practices.
Our goal with this project is to educate more people about stop and frisk practices in Boston. Specifically, we want to target people who have not been subjected to stop and frisk practices, and have not experienced racial or socioeconomic discrimination from law enforcement firsthand. In Boston, this includes middle to upper class Bostonians, many of them white, who may recognize the term stop and frisk, but know very little about whether or not it is a problematic practice. Because of their affluence, race, and status, people in this demographic tend to be in a greater position of power to bring about political change that can improve the situation.
To accomplish this goal, we wrote a satirical article that blends a light hearted, humorous fake news story with the facts about stop and frisk practices in Boston. We chose to incorporate the facts into the article as an annotation layer, where the reader can access them as pop-ups while moving through the article. The map toggles back and forth between a manipulated version that matches the satirical content of the article (where most stop and frisk incidents occur in Brookline and Milton MA) as neighborhoods with high numbers of stop and frisk incidents), and the real data (where stop and frisk incidents are concentrated in Dorchester and Roxbury, MA). The article appears on The Olive, a website we built that is targeted at the middle to upper class, white Bostonians that we want to educate about stop and frisk.
We used humor in our article as a strategy for achieving a higher level of engagement with our audience, and making readers more open and receptive to learning about the many issues with stop and frisk practices in Boston. We wanted to draw in readers that might not choose to read a serious article about stop and frisk, but would be willing to learn about it within the context of satire, and are in a position to actually do something about it. Finally, in the call to action section, we also took advantage of the personal story: although we were unable to interview someone directly for the development of the site, we embedded a video the ACLU of Boston did that told the story of Ivan, a Boston resident who has been stopped more than 30 times.
We also offer readers a number of options for taking action on this issue, ranging from the simplest (sharing the article on Facebook or reading more about it) to more involved (donating to the ACLU or signing a petition to Mayor Marty Walsh). We hoped that by offering so many options for taking action, we would encourage readers to engage at whatever level suits them.
Project Assessment
To assess our project, we conducted five semi-structured interviews with undergraduate students at MIT (in an ideal world, we would interview people in our target demographic, but within the constraints of this project, we went with who was available). Our readers included two white students and three asian students. Overall, most of our readers recognized the term stop and frisk, and knew what it was, but did not know any statistics about it.
Several of our readers laughed out loud while making their way through the article, and enjoyed the humor of the satire. Others did not find the article humorous, particularly those that weren’t familiar with SoulCycle. This dichotomy of reactions emphasized that humor is highly subjective, and challenging to use effectively for the purpose of appealing to a broad audience. Again, interviews with people in our target demographic would give us a better sense of whether or not the humor works within our target context.
One technical issue we encountered is that our subjects did not realize the highlighted portions had pop-up statistics associated them, and read the article without clicking on them. With more time and technical resources, we would either make the statistics so they popped up when the mouse hovered over the text, or have the first statistic pop up automatically to make readers aware of the annotation layer.
It is always difficult to get readers to actually take action after reading an article, but our strategy of offering different options seemed to work-our readers were diverse in action they were willing to take action: two said they would sign a position, two said they would read more information, one said she would like the BLM Facebook group.
