
Quick Question
The plots below show the relationship between two of the independent variables considered by Ashenfelter and the price of wine.
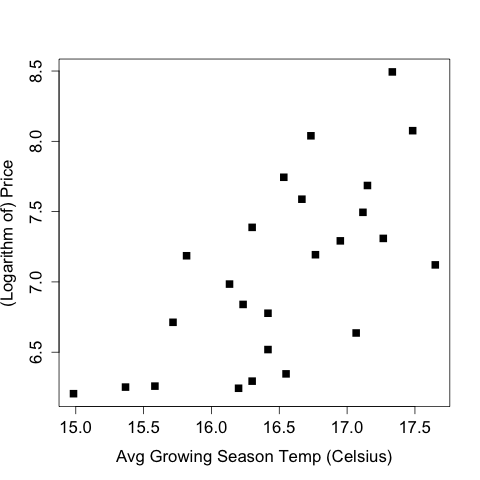
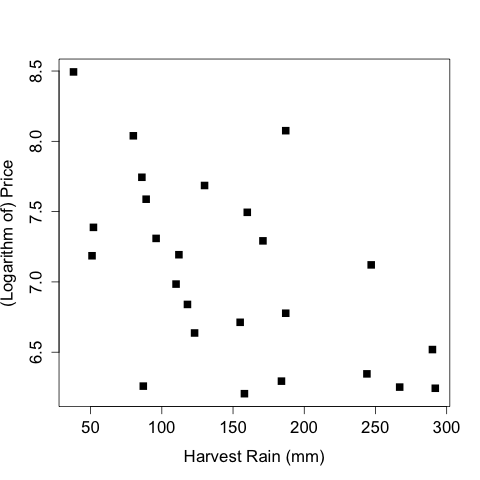
What is the correct relationship between harvest rain, average growing season temperature, and wine prices?
Explanation
The plots show a positive trend between average growing season temperature and the wine price. While the trend is less clear between harvest rain and price, there is a slight negative association.