
Quick Question
In this quick question, we'll be asking you questions about the following three plots, that we saw in Video 1. We'll refer to them as the "Scatterplot", the "Histogram", and the "US Map".
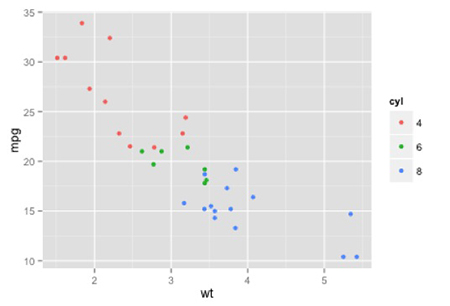
The Scatterplot:
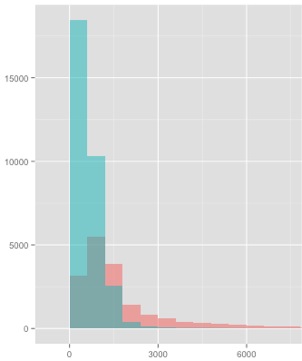
The Histogram:
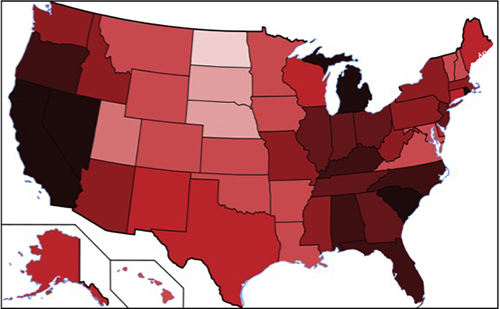
The US Map:
In the Scatterplot, what are the geometric objects?
In the Histogram, what are the geometric objects?
In the US Map, what are the geometric objects?
All three of these plots defined a particular aesthetic property. What is it?
Explanation
The geometric objects for the Scatterplot are points, for the Histogram are bars, and for the US Map are polygons (the States). All three plots defined colors in the plot.