

Week 3: Innovations in the 1980s and Beyond
Week 3 Poll Data
Students' responses to the question: How responsible do you feel that corporations should be toward the following groups?
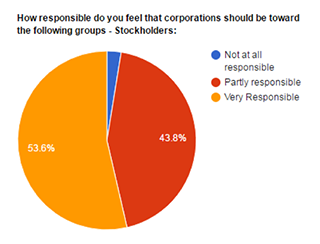
Stockholders:
- 2.6% Not at all responsible
- 43.8% Partly responsible
- 53.6% Very responsible
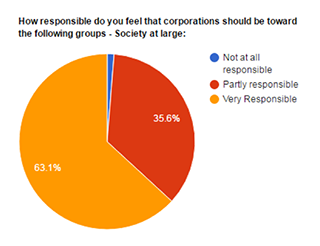
Society at large:
- 1.3% Not at all responsible
- 35.6% Partly responsible
- 63.1% Very responsible
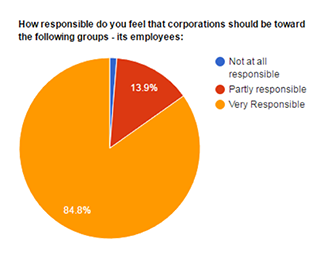
Its employees:
- 1.3% Not at all responsible
- 13.9% Partly responsible
- 84.8% Very responsible
Discussion Forum: The Purpose of the Corporation
For those of you that believe that corporations should be accountable to a broader range of stakeholders (beyond their immediate shareholders), why do you think this?
What is the role of government in ensuring corporate social responsibility? How and when (if at all) should government intervene to promote corporate social responsibility?
