Summary
Objective: Participants get practical background on methane leaks, and initial hands-on experience with the tools for detecting leaks, measuring the volume of gas released from a leak, and tracking and visualizing leaks.
Session structure: Four-hour session in a makerspace, split into three parts.
Instructional Approach:
- Pre-plan at least a couple of potential solutions, and set up each in a dedicated physical area of the room. Move as a group from solution to solution briefly outlining them. There will also be one area for people to develop their own ideas.
- In hackathon style, participants will self-sort into project groups, then define and work on a detailed product or a modification to something existing. One person in each group is assigned to take notes.
Part 1: More About Methane Leaks
A brief lecture and discussion about methane leaks, building on Session 1, to orient all hackathon participants to the nature of the challenge.
Instructors: Nathan Phillips (Boston University), Audrey Schulman (HEET)
Outline:
- The role of methane in global warming
- Importance of and uncertainty about leaky infrastructure (including gaps in knowledge)
- History of natural gas infrastructure installation nationally and in Boston area
- Protocols for detecting, reporting, monitoring and fixing methane leaks
- Opportunities for community involvement
Part 2: Hackathon with two parallel tracks
Track 1: Tools and Methods to Measure Methane Leak Volume
Explore tangible, specific solutions to the methane leak measurement problem, considering practical restrictions and desired results.
- Demonstrate some of the equipment used today for measuring emissions from semi-excavated known leaks.
- Figure out how much gas is coming off each leak.
- Use that measurement to help utilities find and fix the worst leaks.
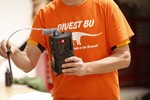
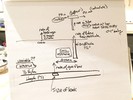
The following photos and video illustrate the nature of the discussions and the process in one of the hackathon groups.
Instructors: Audrey Schulman (HEET), Zeyneb Magavi (Mothers Out Front)
Track 2: Methane Leak Data Analysis and Visualization
Note: In this year's class, all the participants wanted to work on the Tools and Methods track; no takers for this data analysis and visualization track. For future offerings, be sure to invest in specific outreach to the expertise we need to have involved (here, the coding / hacking community). Following are suggestions on what this track might have covered, had it actually occured.
We have mounds of data on gas leaks, and would like to make more effective use of it. Data sources include:
- Utility-reported leak data and gas main replacement plans.
- HEET "Squeaky Leaks" maps and data of over 200 MA communities.
What projects could be done? Some possible directions: Database building, app development, data collection equipment design / construction, data visualization, GIS data processing and Google Earth maps, animation / infographic design for public campaigns, emissions modeling...
Some things we might want to learn from data:
- Where do leaks overlap with the gas main replacement plans?
- Where do Picarro-mapped leaks match utility-reported leaks?
- Are gas mains being replaced more frequently in low or high income communities?
- Have levels of methane been rising higher over fracking areas? Other correlations?
Part 3: Wrapup, Report Back and Synthesis
No direct documentation is available from this wrapup and synthesis segment.
Postscript
Throughout 2017, Mothers Out Front and the Gas Leaks Allies coalition continued on some of the concepts explored in this hackathon. In October 2017, they announced successful results with a test methodology to measure gas leak volume using the FLUXBar tool.
This video is from HEET (Home Energy Efficiency Team) on YouTube and is not covered by our Creative Commons license.
See the Gas Leaks Allies' "Common Ground, Uncommon Partners," featuring video of their October 3, 2017 symposium at MIT.
News coverage: Craig LeMoult. "In An Unlikely Partnership, Local Environmentalists And Utilities Work Together To Reduce Gas Leaks." WGBH News, November 29, 2017.


