
Investigation Summary / Review Project
Overview: Students create their own "trick" photographs and share with a partner group who develop two alternative models to explain their observations of the photo using their new understanding of the relationship between linear width, angular width and distance.
Electronic resources: example trick image (example of trick photo).
Physical resources: digital cameras.
Instructor introduces requirements of wrap up activity:
- Instructor shows a few examples of trick image, including a description of observations about each one, and 2 alternative models (explanations) for what is happening in each image.
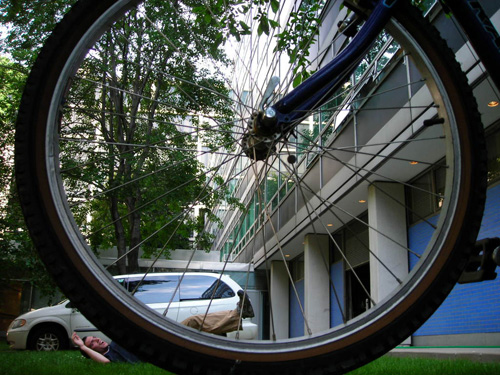
- Example for image of bike tire crushing a person
- Observation: In this image, the angular diameter of the bike tire is about two times the angular length of Peter's whole body. The angular length of the bike fork holding the tire is about the same as the angular length of Peter's body. Peter is at the lower edge of the bike tire, and the top half of him is to the left of the tire.
- Model 1: There is a large bike tire with a linear diameter of about 12 feet that is crushing Peter whose linear length is about 6 feet. Both of these things are at about the same distance from the detector (camera).
- Model 2: There is a regular bike tire with a linear diameter of about 1.5 feet which is only a small distance from the detector, explaining why its angular diameter is so large. Peter has a linear length of about 6 feet, but is much farther from the detector.
- Predictions from Model 1 and 2 in written notes form: trick photo writeup
- Each student is responsible for "directing" the creation of one trick image, using members of the group and buildings/props around the area.
- Examples of student-created trick photos: trick photo 1, trick photo 2, trick photo 3, trick photo 4
- Student groups then vote on their favorite trick image (or two) which is then given to another group.
- Each other group must then produce, for each trick image they were given, the following:
- A written statement of observations of the situation, that can only be determined from the image. This observation must include the phrases "angular width" or "angular height", etc.
- A written statement of two alternative models (explanations) for what is happening in each image. These models must include the words "linear width" or "linear height" and "distance to the detector (camera)"
- For each model, a prediction of what the situation would look like if it was viewed from the side, instead of from the camera's point of view. This should be a diagram, labeled with distance to the detector and linear height/width.
- Groups then present their models to the original group who made the image, and confirm that the prediction from one of the models is incorrect, and must be ruled out.
Teacher tips/tricks:
- Each group can analyze one or many images from the partner group, depending on the amount of time available.
Additional / Alternative Activities for Investigation 1
With additional thought and planning, this activity could be used as an alternative for or extension to activity 4, as it involves working with angular size, linear size and distance.
Proper Motion
An application of angular separation or angular distance moved
Overview: Students investigate proper motion of planets to measure their velocities.
Electronic resources: Strobe images (bouncing ball, drip sequence, edgerton baseball,); Images of moving planets, Mars052208040040 (FITS), Mars052208053111 (FITS), Neptune111304033452 (FITS), Neptune111704040207 (FITS), Heavens Above Solar system
Physical resources: None
Finding speed of an object on earth, from images:
- Observe photos of car (or airplane or baseball) taken as it passes. How can we tell it's moving? How fast? (i.e. We must find how far away it is first!)
- Outline how you'd figure speed of baseball in strobe picture. (If we know how long between each strobe, and we can find the linear distance moved, we can find the speed= change in distance / change in time)
- If time: actually solve for the speed of the baseball in strobe picture. (Assume change in time between each strobe exposure is 1/60 of a second, and if separation between balls is about 1 foot (~0.3 meters), we get a velocity of 0.3 meters / 1/60 second = 18 meters/second = about 40 miles per hour.) This ignores the angular /linear size calculation, though!!
Finding speed of a planet, from images:
- Do same with planet moving against pattern of stars in background. Given its distance from Earth on the date of observation.
- Mars: time between images= 5.43 x 10³ seconds. distance = 1.81 AU = 2.71x10¹¹ m.
- Neptune: time between images = 3.47 x 10⁵ seconds. distance= 30.23 AU = 4.52 x 10¹² m.
- Two different planets show different speeds, but it's not exactly the predicted velocity from Heavens Above. Why not? (Planet doesn't always move perfectly across our line of sight)
- Accepted velocities — Mars: 21.98 km/s, Neptune: 5.43 km/s
- Compare to "accepted" speed of planet: 2pi*r / period = velocity
- In the same way that we can't tell if an object is flat or bulging toward us (connect back to blocks at beginning?), we can't tell how its moving, except across our line of sight... this will come back in galaxy cluster investigation