
Developing and Using Flux / Luminosity Relationship
Overview: Students explore several images to motivate the ideas that several effects contribute to how much light is collected when making an image. These factors must be included when translating between an image and a measurement of luminosity for an object. Students then use CCD images and their understanding of exposure time and flux/luminosity to measure the luminosity of the Sun.
Electronic resources: Lightbulb comparison image (lightbulb_brightness5.fits) (FITS), Orion nebula 30 second exposure (Orion_30s.fits) (FITS), Orion nebula 45 second exposure (Orion45shifted.fits) (FITS)
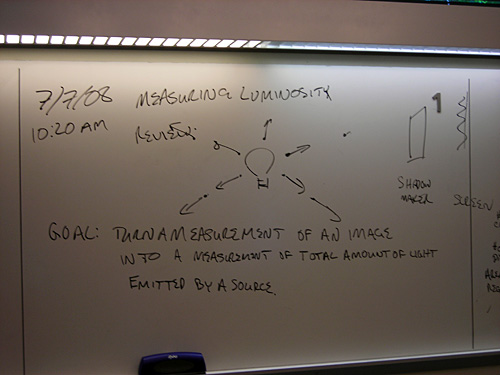
Instructor presents the goal: We want to turn a measurement of an image into a measurement of the total amount of light emitted by a source. What has an effect on the number of counts we collect from an object? Notes: luminosity intro
Observations about what affects number of counts obtained in an image of a certain source:
- Actual light energy output: Students observe the difference between two bulbs in the same image, using the "counts in regions" Chandra Ed tool, using a circular region around each bulb. We collect more photons from the brighter bulb. Image showing two bulbs of different luminosity: lightbulb_brightness5.fits (FITS)
- Teacher note: this "effect" is included in the luminosity term of the mathematical relation below.
- Exposure time: Students observe the difference in counts between the same regions of two images of the same object (Orion nebula), taken with different exposure time. The longer exposure time image has higher counts in the same region.
Teacher note: This effect is included in the flux measurement.
- Area of the collector: Recall the classroom kinesthetic model: a larger collector will collect more of the light emitted.
- Teacher note: This effect is included in the flux measurement.
- Distance from object to collector: Recall the classroom kinesthetic model: the further away the collector is, the less photons/light/energy it collects. (The graph paper collectors were illuminated less as we looked at them from behind.)
- Teacher note: This effect is included in distance term of the mathematical relation below.
- Collector efficiency: Recall that photons are measured when the detector turns them into electrons which are then counted, giving us our measurement of "counts". In this way, a certain amount of energy from a photon is turned into a certain number of counts.
- Teacher note: This effect is included in the flux measurement.
Develop a mathematical relationship describing how flux and luminosity are related:
- Recall relationship from classroom kinesthetic model, and derive the relationship between flux and luminosity: Notes: flux luminosity
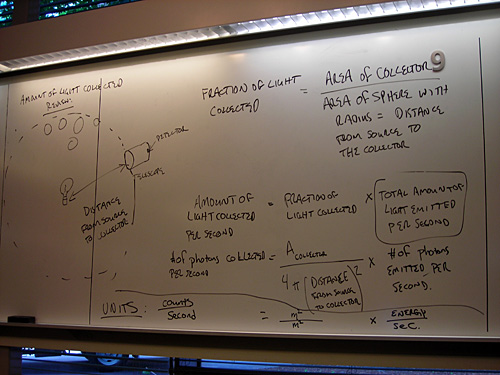
- Amount of light collected = fraction of light collected * total amount of light emitted
- Amount of light collected = (Area of collector / area of sphere needed to collect all light) * total amount of light emitted
- Add in all the effects examined above to get more information about the "amount of light collected" term on the left. All this depends on what specific telescope/detector combination you are using:
- Change from counts to energy for a particular telescope/detector combination using the collector efficiency (for light bulb image taken with MicroObservatory telescope, 1 count = 10-8 Joules)
- Divide by exposure time (10 seconds in light bulb image taken with MicroObservatory telescope)
- Divide by the collecting area of finder telescope on MicroObservatory (circular collecting area with 1.5 inch diameter) = 1.1 x 10⁻³ m2
- We obtain: Notes: flux luminosity math
- Energy collected per second = (Area of collector / area of sphere) * energy emitted per second
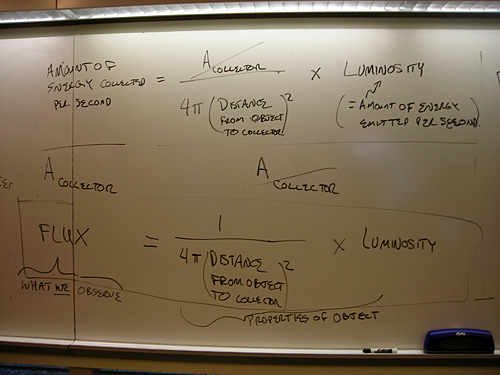
- In order to gather all the information that only comes from the telescope/detector on the left side of the equation, we rearrange to get
- Energy collected per second / Area of collector = energy emitted per second / area of sphere
- These terms are defined as:
- Flux = energy collected per second/ area of collector
- Luminosity = energy emitted per second by the source
- Area of sphere = 4* Pi * (Distance from source to detector)2
- Leaving us with the relationship:
- Flux = Luminosity / (4*Pi*(Distance from source to detector)2)
Apply the mathematical relationship
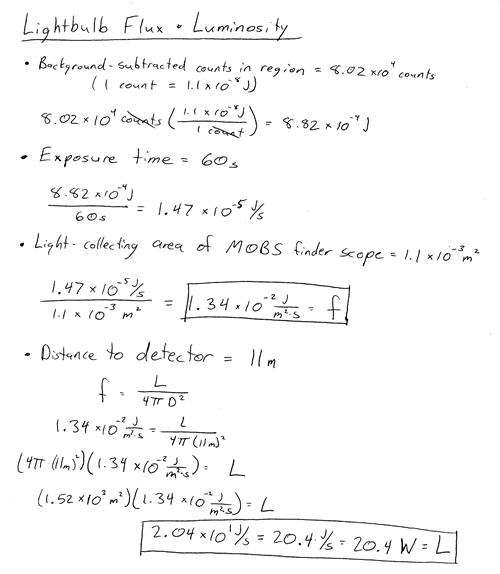
- Students predict the luminosity of a light bulb, using the flux obtained from an image of a 200 Watt light bulb taken by MicroObservatory from 11 meters distance. (Prediction should be about 20 Watts, given about a 10% efficiency for light bulbs–other energy emitted as infrared light.)
- Example calculation of lightbulb luminosity prediction, and regions used for background subtraction: lightbulb flux
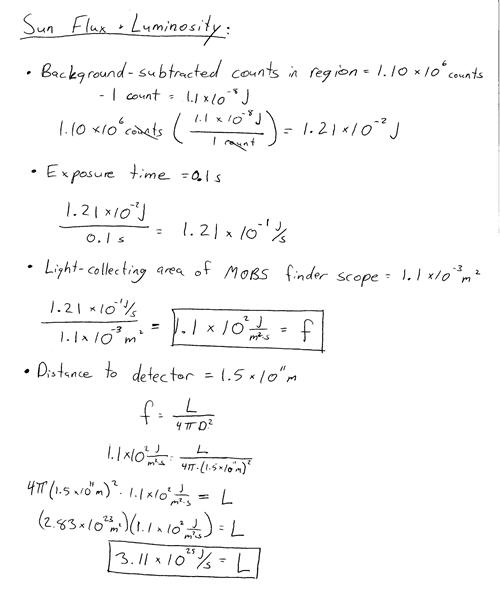
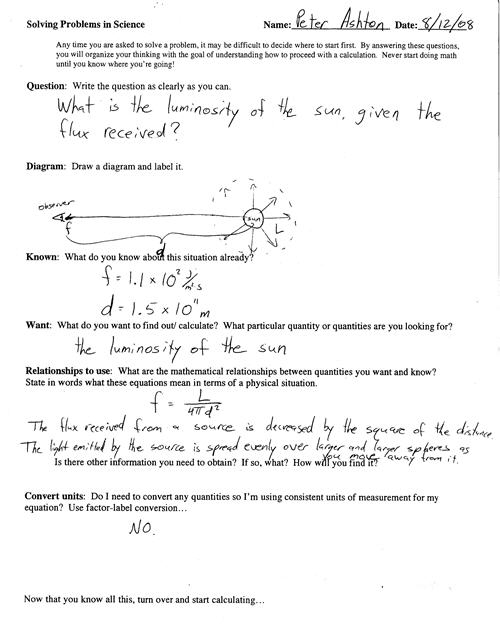
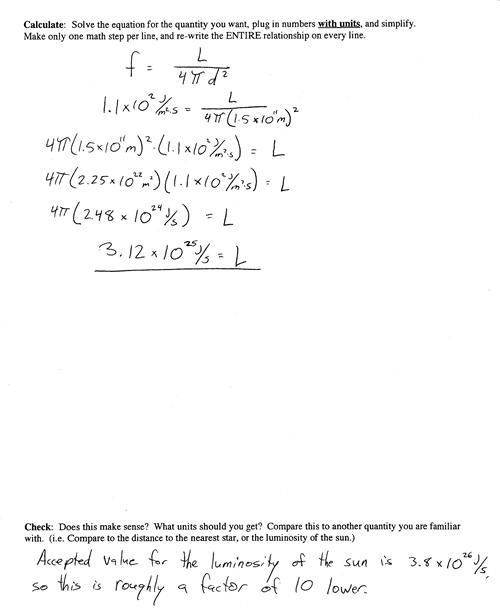
- Students predict the luminosity of the Sun, using the flux obtained from an image of the sun taken by MicroObservatory. (Prediction from image should be about 1.3 x 1025 Watts, with actual about 4 x 1026 Watts.)
- Example calculation of sun luminosity prediction, and regions used for background subtraction: sun flux, sun luminosity, sun luminosity2
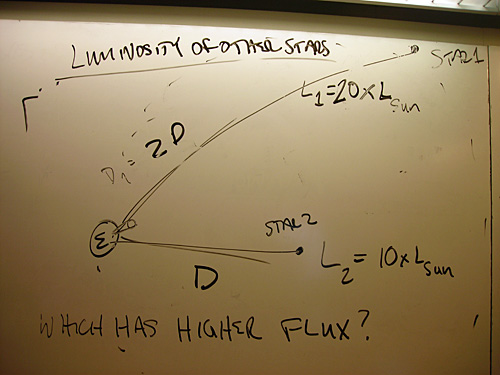
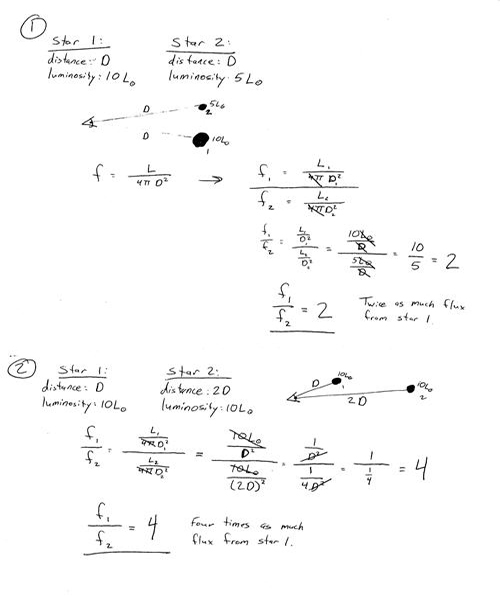
- Wrap up challenge: Set up a hypothetical situation of two stars, asking students to predict from which star we'd receive a larger flux:
- Notes: flux comparisons
- Star 1: Distance = D, Luminosity = 10 * L_sun, Star 2: Distance = D, Luminosity = 5 * L_sun (We collect more flux from star 1.)
- Star 1: Distance = D, Luminosity = 10 * L_sun, Star 2: Distance = 2D, Luminosity = 10 * L_sun (We collect more flux from star 1.)
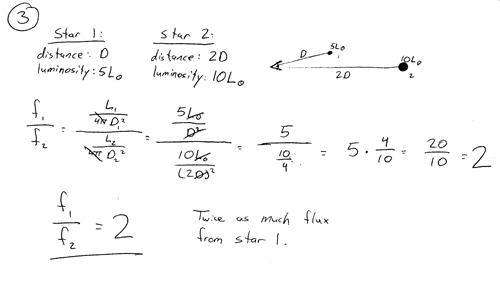
- Star 1: Distance = D, Luminosity = 5 * L_sun, Star 2: Distance = 2D, Luminosity = 10 * L_sun (We still collect more flux from star 1, because distance has a larger effect. Easy to show if you take the ratio of the two fluxes, in terms of the luminosity and distance.
- Example calculation of ratios of luminosity of these three stars: comparing star flux1, comparing star flux2
Teacher tips/tricks:
- Timing: In 2008, this took about 4 hours, but was done in a much more time consuming way of talking about each effect, and then explicitly calculating the different values for a particular image of a lightbulb taken with MicroObservatory.
- If desired, students can be given flux measured from the lightbulb and sun images and use the flux/luminosity relationship directly, or they can use the Chandra Ed "counts in regions" tool with a background to then make their own measurement. See example calculation.
- It may be easier to do the Wrap up challenge before the actual calculations, especially if students are still conceptually unclear about flux and luminosity.
Assessment:
- How is the way a detector works different from how our eyes work. What happens if we "expose" our eyes for a longer time. (Our eyes "read out the detector" about every 1/30 of a second, so we continually "take images".)
- Define and or diagram flux and luminosity in terms of the particle model of light (i.e. use the words photon, straight lines, and collector).
- What are the units of each quantity? Flux, luminosity and distance.
- Which of the following are associated with flux, and which with luminosity?
- Units: Joules/sec/m2, Joules/sec
- Energy collected, energy emitted
- observation, prediction
- Would be a different number if we lived on Mars. Would not be a different number if we lived on Mars.
- In our efforts today, what were the observations (distance and flux, as determined from the image) and what were predictions (luminosity of the bulb and Sun) and what were the models (the mathematical relation itself)?
- How is the mathematical model (equation) we developed here similar to and different from the model of colored shapes we built in investigation 1?
- Some students have said that flux is like an "angular luminosity". How is the relationship between flux and luminosity similar to the relationship between angular width and linear width?