
Kinesthetic Spectrum Detection Model
Overview: Students create a source / detector system to demonstrate the effects of intervening material and detector response.
Physical resources: Candy (assorted colors), histogram paper (link below), tub of water, milk, flashlight.
Electronic resource: Images of Sunset
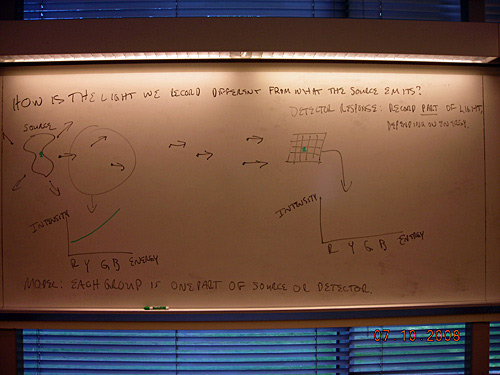
"How is the light we record with our detector different from the light that was emitted by the source?"
- The spectrum we record looks different from what was emitted because the detector is not equally sensitive to photons of all energies.
- Motivate this by showing IR remote control response on a video or digital camera: Our eyes are not sensitive to photons of this energy (< 1.8 eV), but the camera detector is.
- Draw diagram of source -> detector, indicating that students will predict the spectrum of light that is traveling or recorded at each stage. See images in teacher tips/tricks section.
Simple source / detector:
- Students are broken into 3 groups: Source, "space between source and detector" and detector, and placed in front of the diagram, reflecting the order in the diagram. Notes outlining outputs of model to students: (kinesthetic setup)
- Depending on the properties of the source, it emits a different mixture (or spectrum) of light.
- Source students and detector students are each responsible for a certain color of photon, which we represent in the model as colored chocolate candies.
- Detector is not equally sensitive, it only records a certain fraction of the photons it receives.
- Cycle of kinesthetic model phases:
| DESCRIPTION OF WHAT HAPPENS IN REALITY | CORRESPONDING DESCRIPTION OF WHAT HAPPENS IN KINESHETIC MODEL |
|---|---|
| Source emits a certain mix of photons (spectrum) each second | Source students count out correct number of colored candies |
| Light takes time to travel through space to the detector | "Space between" students transfer candies from the source students to the detector students |
| Some of that light is recorded by the detector, in the form of a spectrum | Detector students count out the number of candies that have been detected, "discarding" the others |
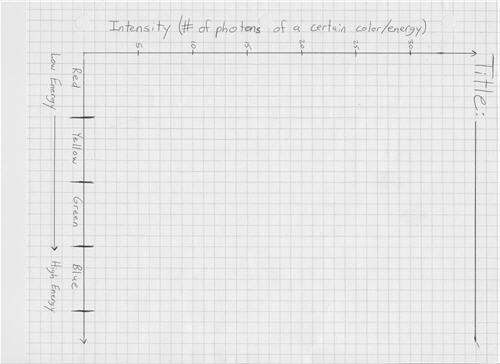
- This model should be run one time through (source emit, space transfer, detector record), then have students proceed through the model several times, simultaneously. Source, space and detector students are working at the same time (i.e. by the time the first bunch of candies has reached the detector, there is another in space, and a third being emitted from the source.) When students get the hang of things, have them freeze time, and record the spectrum they have just emitted, transferred or recorded in the following histogram plot template: (kinesthetic absorption histogram)
- Post these spectra at the proper place in the diagram on the board, and ask students to explain why the spectra look different.
- From the charts below, the first model should have Source: Flat spectrum; Detector response: Detector 1 and Absorption effect of space: Empty space.
- To emphasize the fact that different sources emit different spectra, depending on their properties, repeat the model, including creating histograms, with the following "settings":
- Source: Crab nebula; Detector response: Detector 1; Absorption effect of space: Empty space. Note that the spectrum does not have a strong peak at blue anymore!
- If desired, replace the source with the Sun
Source / dust / detector:
- Motivate the effect of interstellar dust (clouds) by showing images of our Sun at sunset and during the day. Observe differences: color looks redder. ll
- Instructor demonstrates the effect of particles in the way of light by adding several drops of milk to a container of water, and shining a light through the container. In the path of the light, it now looks red, and from above, one can observe the blue light being scattered out of the path. Thus, particles or material in between the source and detector (in this case, our eye) can affect the mixture of colors (spectrum).
- To include this effect in the kinesthetic model, use the following "settings":
- Source: Flat spectrum; Detector response: Detector 1; Absorption effect of space: Dust 1
- If desired, repeat with Crab or Sun source.
Model of detecting X-rays with Chandra:
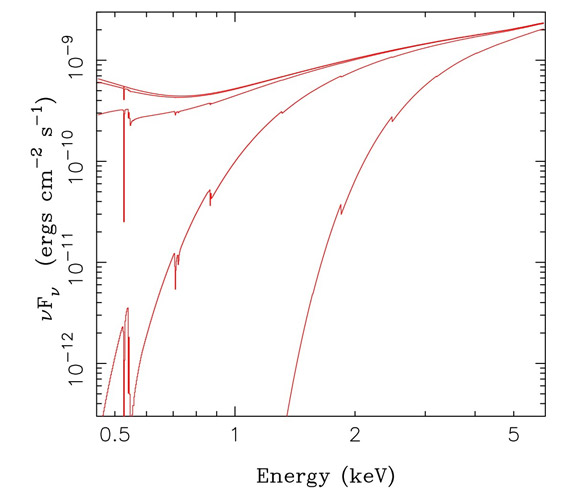
- (Interstellar dust affects X-rays) The top line is for almost no dust, and then the lines further down represent the low, medium and highest amount of dust that is likely to be between Chandra and most X-ray sources. The Y-axis essentially represents the amount of light which is able to pass through the dust. In other words, the more dust, the less likely we are to collect low energy photons.
- Students should repeat the model, including creating histograms, to represent Chandra, using the following "settings":
- Source: flat spectrum; Detector response: Detector 2; Absorption effect of space: Dust 2
| KINESTHETIC MODEL "SETTINGS" | RED (=LOW ENERGY) | YELLOW | GREEN | BLUE (=HIGH ENERGY) |
|---|---|---|---|---|
| Source spectra in photons emitted per second: | ||||
| Flat spectrum | 20 | 20 | 20 | 20 |
| Crab nebula (blue region) | 10 | 15 | 20 | 25 |
| Sun | 15 | 25 | 15 | 10 |
| Detector response (in fraction of photons recorded): | ||||
| Detector 1 (like human eyes / MicroObservatory, less sensitive to blue) | 5/5 | 4/5 | 3/5 | 2/5 |
| Detector 2 (like Chandra, less sensitive to low energy) | 2/5 | 3/5 | 4/5 | 5/5 |
| Absorption effect of space (in fraction of photons allowed to pass): | ||||
| Empty space | 5/5 | 5/5 | 5/5 | 5/5 |
| Dust 1 (like clouds on Earth, like sunset model with visible light) | 5/5 | 5/5 | 4/5 | 3/5 |
| Dust 2 (like interstellar dust, which affects X-ray measurements) | 3/5 | 4/5 | 5/5 | 5/5 |
Teacher tips/tricks:
- Timing: about 2 hours, longer with more alternative "settings" of the kinesthetic model.
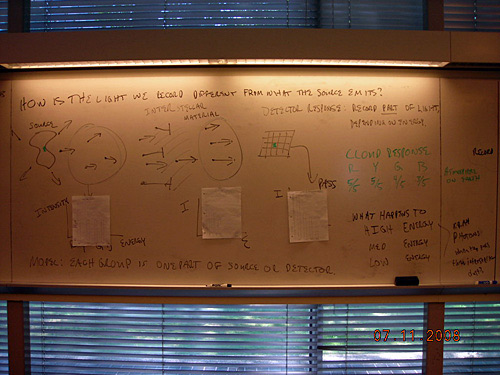
- Eventually, the drawn diagram should look like this: (setup with histogram) The recorded "candy spectra" are posted at each appropriate location at the completion of a "round" of the model for review and description by the students. Additional results for other models can be added in a row underneath for comparison.
- Before the activity starts, separate chocolate candies into large piles of same color candies.
Assessment ideas:
- Make predictions as to what might be happening with several example spectra, giving students the detector and dust responses, but without doing the kinesthetic model.